


Streamlining Display and Automotive Lighting Evaluation — A New Standard Enabled by the 2D Spectroradiometer SR-5100
In the development site of displays such as smartphones, TVs, and in-vehicle indicators, it is essential to quantify visual factors such as luminance, chromaticity, and uniformity to ensure the designed brightness and color performance.
However, while conventional colorimeters can measure luminance and chromaticity, they do not allow for root cause analysis when measurement issues occur.
It’s often said that it’s hard to find practical information about optical evaluation and root cause analysis by online searches alone.
SR-5100 provides a practical solution to the technical challenges of performing root cause analysis.
This article introduces how SR-5100 is utilized throughout the process — from research and development to mass-production evaluation.
Typical Challenges and Case Solutions in R&D Site
The challenges faced at the development site are equivalent to the technical evaluation challenges that the R&D department must resolve.
Let’s first organize the challenges that frequently occur in the field and look into what kind of technical requirements are needed
Due to differences in measurement standards across departments and sites, the measurement results are inconsistent.
In the past, differences in measurement standards between departments or with external partners sometimes resulted in inconsistent measurement results.
In particular, when different colorimeters or luminance meters are used at different sites or by different partners, differences between instruments can lead to inconsistent measurement values, which in turn hinder development speed and global expansion.
In addition, differences caused by measurement timing and the inability to explain color discrepancies quantitatively—so-called “the barrier of quantification”—have been major issues.
SR-5100 enables smooth data sharing between departments and business partners, thanks to its minimal instrument differences and high-precision measurements of luminance and chromaticity.
Conventional measuring instruments require a long measurement time.
For example, in the case of spot-type measuring instruments, evaluating products with numerous measurement points, such as meter panels, sometimes required an entire day.
In contrast, SR-5100, can acquire full-surface spectral data in just a few minutes. As a result, measurement efficiency is dramatically improved, contributing to shorter development cycles.
SR-5100, with its two-dimensional measurement method, can acquire data from multiple points simultaneously in a single operation.
As a result, it leads to a reduction in man-hours per sample.
The challenges in measurement accuracy and data sharing are not only related to the performance of measuring instruments themselves, but also to issues of consistency and reproducibility in evaluation standards.
In the next section, based on these challenges, we will summarize and explain the essential requirements for luminance meters that are needed in R&D departments.
What Are the Requirements for Luminance Meters in R&D Departments?
Let’s consider what kind of performance R&D departments require of luminance meters to address on-site challenges such as consistency and reproducibility in evaluation standards from a technical perspective.
First of all, it must be capable of achieving measurement accuracy consistent with the catalog specifications.
The catalog specifications are guaranteed through calibration using Standard Light Source A, which is a steady light source with a broad spectrum.
Although the catalog specifications of filter-type colorimeters and spectroradiometers using spectroscopic methods seem to be the same, actual measurement targets vary widely.
It is required that measurements be performed with the same level of accuracy as the catalog specifications, regardless of the measurement target or environment.
This is because, in filter-type colorimeters equipped with XYZ sensors designed to match the human eye’s color-matching functions, each XYZ sensor is not a monochromatic detector but a mixed-color detector with sensitivity over a certain wavelength range.
In particular, measurement errors tend to occur more easily when measuring monochromatic light such as red or blue.
However, spectroradiometers measure the energy at each wavelength and calculate luminance and chromaticity using color-matching functions, enabling high-accuracy measurements even for various types of light sources.
Visualizing the Ambiguous Indicator of “Visual Quality
It is important to quantify human-perceived visual discomfort, especially in automotive lighting and display applications.
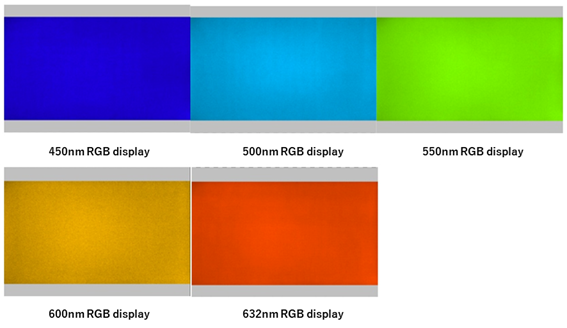
SR-5100 2D spectroradiometer acquires spectral distributions from 380 to 780 nm as 401 spectral images and calculates luminance and chromaticity.
It quantifies subtle color unevenness and mura that were previously overlooked, making “visual quality” visible.
What is required in R&D is not only high-precision measurement, but also the ability to quantify the ambiguous concept of “visual quality” in a way that can be commonly understood by everyone.
In response to these requirements, the next section will examine what kinds of measurement approaches are effective, using SR-5100 as an example.
What Makes SR-5100 the Preferred Choice for R&D Departments
As a luminance colorimeter that meets the requirements presented in the previous chapter, how is SR-5100 being evaluated?
In this section, we will summarize the reasons for selection from the developer’s perspective.
Quantifying “visual discomfort perceived by the human eye”
Conventional spot-type spectroradiometers can measure the luminance, chromaticity, and spectral distribution of a single point with high accuracy, but it has been difficult to obtain spatial information such as brightness distribution across the entire screen.
On the other hand, 2D colorimeters can map the luminance and chromaticity distribution across the entire screen and are excellent for detecting mura and defects. However, because they use a filter-based method, errors tend to occur when the light source has a complex spectrum.
SR-5100 combines these advantages in a single instrument. It can measure not only the luminance and chromaticity distribution across the entire screen, but also the spectral distribution with high accuracy.
This enables the quantification of visually perceived discrepancies and allows for accurate evaluation of the characteristics of light sources and objects.
Furthermore, it supports a wide range of applications—including evaluating the spectral characteristics inherent to objects, assessing reflected light, and performing simulation-based analyses—while enabling spectral evaluations of up to approximately five million points.
Conventional colorimeters calculate luminance and chromaticity from three images corresponding to X, Y, and Z.
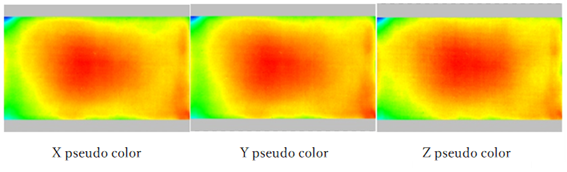
SR-5100 calculates luminance and chromaticity from 401 images covering 380 to 780 nm, enabling the quantification of visually perceived discrepancies.
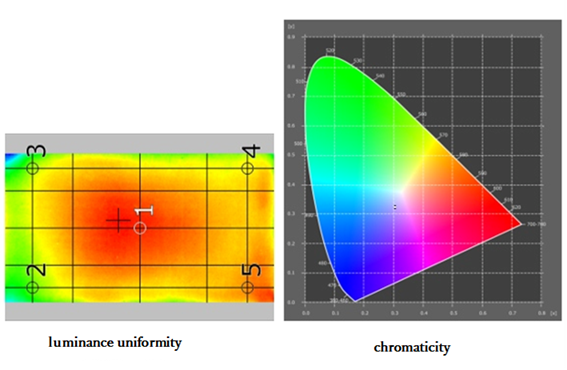
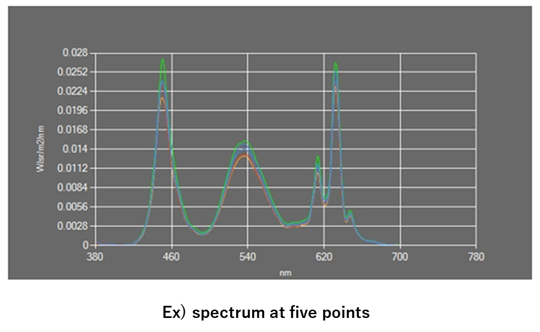
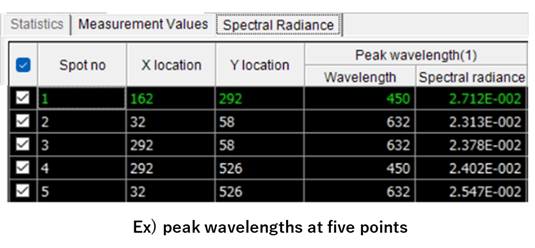
Differences can also be analyzed using five-point spectral data and peak wavelengths within the 380–780 nm range.
SR-5100 allows the measurement conditions to be reviewed afterward, enabling root-cause analysis.
Conventional colorimeters retain only numerical data, making it impossible to review the measurement conditions afterward.
SR-5100 can save not only numerical data but also measurement images, allowing the measurement conditions and results to be reviewed afterward, and enabling spectral data to be used for solving problems and performing root-cause analysis as needed.
Furthermore, the live image used for focusing during measurement can also be saved.
Because the measurement image is saved as an image file, additional measurement points within the measurement area can be selected and their data obtained immediately.
Even if measurement points are added later, the data can be obtained without remeasurement.
With SR-5100, various analytical results can be obtained using the saved image data—including arithmetic operations, specific-wavelength images, and spectral differences in the spectral data—enabling comparison of different conditions as well as identification and analysis of failure causes.
While conventional measurement methods cannot quantify discrepancies between the design and the actual device in detail, SR-5100 can visualize where and at which wavelength components the discrepancies occur, significantly shortening the development cycle.
Ensuring accurate luminance and chromaticity measurements.
For SR-5100 calibration, we use light sources that have been calibrated with traceability to national standards (JCSS). This enables highly accurate assurance of luminance and chromaticity measurements.
The presence or absence of traceability has a significant impact on measurement reliability, repeatability, and the validity of product quality assurance.
By visualizing “visual discomfort” that could not be captured by numerical data alone, ambiguity in evaluation is reduced, leading to greater efficiency throughout the design and quality assurance processes.
By ensuring consistency and repeatability in measurement data, and by meeting the requirement of delivering catalog-level accuracy even under diverse light sources and environmental conditions, a unified measurement foundation is established that supports the entire process from R&D through mass production and quality assurance.
Next, we will introduce concrete application cases to show how these capabilities are actually being utilized across different fields.
How SR-5100 Is Used in Product Development|Case Studies and Application Examples
OLED Displays: Luminance, Chromaticity, Spectral, and Uniformity Evaluation
In OLED display development, even slight differences in luminance and chromaticity can significantly affect visual quality. However, due to the limited availability of objective and concrete metrics to quantify these variations, inconsistencies in design and quality evaluation have persisted for a long time.
With the introduction of SR-5100, detailed luminance and chromaticity distributions—including spectral information—can be visualized in a single measurement.
This makes it possible to quantitatively evaluate visual uniformity, allowing it to be used as a common metric shared between the design and quality control departments.
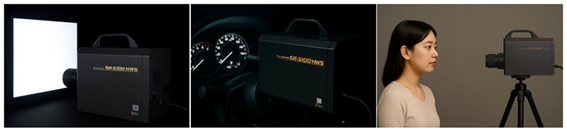
Automotive Indicators / Automotive Lighting: Uniformity Evaluation, Sunlight Readability Assessment, and Color MURA Quantification
In the development of automotive indicators and illumination lighting, variations in light uniformity and visibility have long been design challenges.
Especially for sunlight readability and color MURA tended to be evaluated subjectively, making it difficult to standardize internal evaluation criteria.
With the introduction of SR-5100, lighting uniformity and color MURA can now be quantified at the spectral level.
Because it can maintain stable measurements even under lighting conditions that simulate sunlight, it contributes to daytime and nighttime visibility evaluations as well as the clarification of quality standards.
AR/VR Displays: Color Reproduction Verification for Micro-OLED and LCOS, and Color MURA Quantification
Micro-OLED and LCOS displays used in AR/VR applications have extremely small pixel sizes, so even slight color MURA or differences in color reproduction can significantly affect visibility.
However, conventional measurement instruments have lacked sufficient evaluation accuracy due to limitations in viewing angle and spatial resolution.
SR-5100 enables high-resolution, visual-sensitivity–corrected measurements even in ultra-fine display areas, providing highly accurate color-reproduction verification and color-MURA quantification.
It can contribute to quality improvement from the early stages of development and help clarify internal standards.
Projectors / Specialized Lighting: Reflective Luminance Evaluation and Color Rendering Testing
In the development of projectors and specialized lighting, it is essential to accurately evaluate reflective luminance on walls or screens, as well as color appearance (color rendering) under illumination.
However, with conventional instruments, it was difficult to quantitatively capture the spectral characteristics of reflected light or the illuminance distribution, often forcing evaluations to rely on visual inspection and subjective judgment.
SR-5100 can simultaneously measure luminance, chromaticity, and spectral distribution, enabling highly accurate and highly repeatable evaluations of reflective luminance and color rendering.
Beyond displays and automotive applications, SR-5100 is also used in fields such as environmental analysis, cosmetics, pigment identification in paintings, and even medical applications such as evaluating skin conditions including redness and yellowing.
Conclusion|A Measurement Platform for Next Generation of Visual Quality Evaluation
The ability to share “visual quality” in numerical form has become essential not only in research and development but across all processes, including manufacturing and quality assurance.
Driven by the emerging trend of quantifying “visual quality,” SR-5100 provides a new standard for evaluation processes from research and development through mass production.
Even when different evaluators are involved, the high repeatability enabled by precise wavelength-level spectral data ensures consistent results, allowing for the standardization of evaluation criteria and improved verification efficiency.
It can be described as a next-generation evaluation solution that combines the accuracy, efficiency, and reliability required by engineers.
Please take a moment to review the detailed product specifications of SR-5100 here.